More than 5.6 million GCSE results have been issued to students in England today, along with more than 368,000 results for level 1 and 2 vocational and technical qualifications taken alongside them.
These results enable young people to progress to further study or an apprenticeship. Well done to all students receiving their results today, and to all the teachers and others who have supported them every step of the way.
This year’s picture is one of stability, with outcomes showing only minimal variation from previous years. This falls within the boundaries of natural year-on-year fluctuations.
Key points
That said, here are some key facts and figures from today's GCSE and level 1 and 2 results:
- Overall GCSE results are similar to 2024. Outcomes at grade 7 and above are 21.8% compared with 21.6% in 2024, and outcomes at grade 4 and above are 67.1% compared with 67.4% in 2024.
- 5,661,970 GCSE results were issued in 133 different qualifications.
- There were more entries from post-16 students this summer for GCSE English language and maths. However, within both the 16-year-old and post-16 groups, results are stable.
- Fewer students sat GCSE biology, chemistry and physics but there was an increase in entries for combined science. There was also a decline in entries for history compared with 2024, but a small increase in geography.
- Overall, 4.1% (14,920) of the 368,065 vocational and technical qualification grades issued are at the top grade available. Of those, 355,590 were Technical Awards and 12,475 were Technical Certificates.
- The most widely taken vocational and technical subjects were Technical Awards in Leisure, Travel and Tourism; and Health, Public Services and Care.
- The geographical region with the highest percentage of GCSE grade 7s and above was London, and the north-east had the fewest.
- Boys’ results improved slightly while girls’ results fell marginally.
What are the trends behind the results?
Stable levels of performance
Stability is the watchword with the 2025 GCSE results.
The national picture at grade 4 shows just a 0.3 percentage point reduction from 2024, and just a 0.1 percentage point increase compared to 2019 (see Figure 1).
Figure 1: GCSE outcomes across all subjects, for all ages, at grade 4/C and above, England only
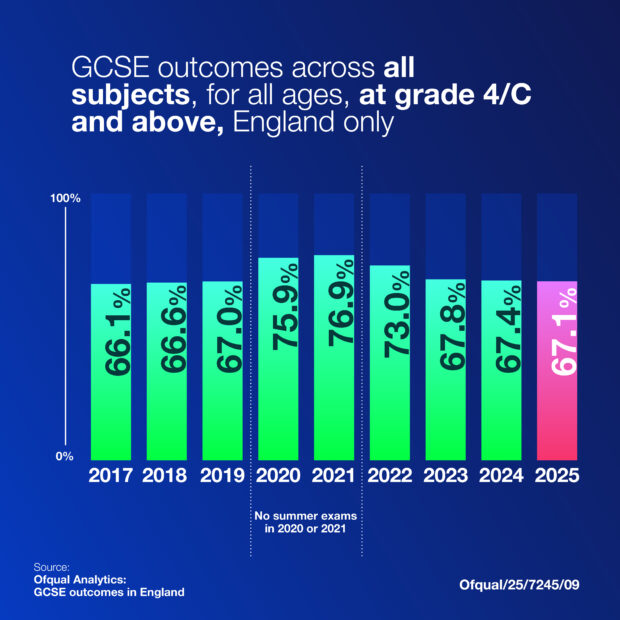
While grades overall are stable, there are still small variations reflecting differences in student performance. However, the standard of work that students must achieve to gain a grade is held consistent year on year, and these results maintain that standard.
The 2025 National Reference Test results, also published today, demonstrate the continuing stability of English language and maths performance outcomes for 16-year-olds.
Post-16 GCSE candidates
Where there is a more notable change is the 14% increase in post-16-year-olds getting GCSE results today. This is due to the greater number of post-16 students taking English language and maths resits.
The higher number of resit candidates is reflected in the changes to English and maths results at and around grade 4 for all candidates combined, compared to last year. In fact, performance within the 16-year-old age group and within the 17+ age group is broadly similar year on year.
Girls and boys
The gap between boys’ and girls’ GCSE attainment has narrowed, due to a combination of boys performing marginally better and girls performing marginally less well than in 2024. These are, again, only small changes.
Regional disparities
As in any year and at any level of qualification, today’s results reflect the regional disparities that exist across England. Within that wider picture, though, it is worth noting that the gap between London and the rest of the country has narrowed slightly at GCSE grade 4.
Vocational and technical results
This is just the second year of Tech Award results since these qualifications were strengthened by changes to their design and structure. Tech Awards are typically the size of a GCSE and cover subjects such as sport, hospitality and catering, and health and social care.
Where to find more details
If you’d like to dig into the data, take a look at our new statistical report on this year’s results and our interactive outcomes charts.
As normal, the Joint Council for Qualifications (JCQ) has published results in England, overall and by subject. These results are also shown in our interactive charts.
Today is the culmination of a lot of hard work, not just by the students involved but also their teachers and those who have supported them along the way. Congratulations to you all.
Amanda Swann
Executive Director for General Qualifications, Ofqual
Recent Comments