High-quality evidence and insights are at the heart of our regulation. By collecting accurate data and producing clear statistics we gain a better understanding of qualifications, how the market functions and we pave the way to a fairer and more efficient system. In this way, we not only ensure transparency and accountability, but we also promote the development of qualifications in the interests of students and apprentices.
We have collected data and published statistics on the system we regulate since Ofqual was set up. Our most longstanding statistical bulletin, the Vocational and other qualifications quarterly, which has National Statistics status, focuses on the regulated qualifications taken in England that are not GCSEs, AS and A levels. Since 2012, we have reported the volume of certificates issued in each 3-month period.
To celebrate the 10-year anniversary of this bulletin, we have created an interactive visualisation so users can engage with the historical data on Vocational and Technical Qualifications. This gives students, teachers, analysts and others interested in these qualifications a new opportunity to interrogate the data collected and published over the past 10 years.
What we can learn
There is a lot we can learn from these trends. I’ve summed up some key takeaways here.
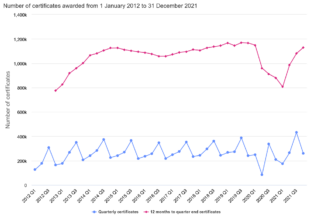
Vocational and Technical certificates are issued all year round, but their uptake shows a strong seasonal element. Most certificates are issued between July and September, when over 2 million certificates are awarded, but there are still around 1 million certificates issued in each of the other quarters. This interactive visualisation shows both the quarterly data, affected by this seasonality, and the sum of the certificates issued in the past 12 months to the quarter end, to allow users to look at the overall trend.
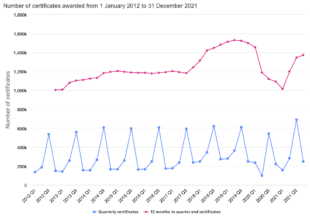
The data includes approximately 11,000 different qualifications from nearly 150 awarding organisations. Just looking at the overall figures may, therefore, conceal a more complex picture. Our interactive visualisation allows users to consider the detail by breaking down the number of certificates in different ways. For example, over the past 10 years there has been a decrease in the overall number of certificates issued for regulated qualifications (other than GCSE, AS and A levels). Although this does not necessarily reflect the change in the number of students taking these qualifications, the drop from 8.1 million to 4.6 million in the certificates issued between 2012 and 2021 is substantial. Yet, when broken down by subject, the data reveals that there has been broad stability in the number of certificates in health, public services and care. And we can also see a steady increase in the number of Level 3 certifications other than AS and A levels, especially since 2017.
Graphs: Number of health and social care certificates (first image) and the number of Level 3 certificates (second image) awarded between January 2012 and December 2021
The likely reasons for these trends are many and varied. They include the numerous changes in the qualifications landscape during this time. For example, the removal of qualifications like International GCSEs from the DfE’s school performance tables has meant a shift toward GCSEs since 2017. Given that GCSEs are not included in this data, this has resulted in a decrease in the number of certificates issued for Vocational and other qualifications. On the other hand, the Post-16 Skills Plan aimed at creating a high-quality Technical Education route may explain the increase in uptake of Level 3 qualifications. Other changes, such as the introduction of new regulatory arrangements under the Regulated Qualification Framework (RQF) and the redesigns of the structure of some qualifications by awarding organisations, might have also influenced the number of certificates issued. Knowing the context is, therefore, key to understanding the data and what it tells us. That’s why each statistical bulletin is accompanied by background notes that we recommend users to consult to correctly interpret these trends.
Lastly, just as for many other areas of our economy and society, the qualifications system has been severely impacted by the coronavirus (COVID-19) pandemic. The impact can be seen in the data. Between April and June 2020, when the country was in full lockdown, the number of certificates issued was the lowest of the past 10 years. Yet, at this time, around 400,000 certificates were still awarded. This is clearly a much lower-than-usual volume of certificates. But together with the 3.8 million certificates awarded between April 2020 and March 2021, it also shows the resilience of the qualifications systems in the midst of the public health emergency. A result that would not have been possible without the incredible effort of teaching and assessment professionals, as well as students and their parents coping with schools, college and workplaces closures, the cancellation of exams and assessments being adapted.
Is this all we can learn from these trends?
Certainly not. There is much more for users to explore in the interactive visualisation we have published today, depending on your interests and needs.
Many more insights are also available on our analytics page, where all our interactive visualisations are hosted with the latest data. These have just been refreshed to make them as accessible as possible. If you have any question or wish to provide any feedback on our statistical publications, please do get in touch with us at Data.Analytics@ofqual.gov.uk
Nadir Zanini
Associate Director for Research, Data & Analytics and Head of Profession for Statistics
Recent Comments