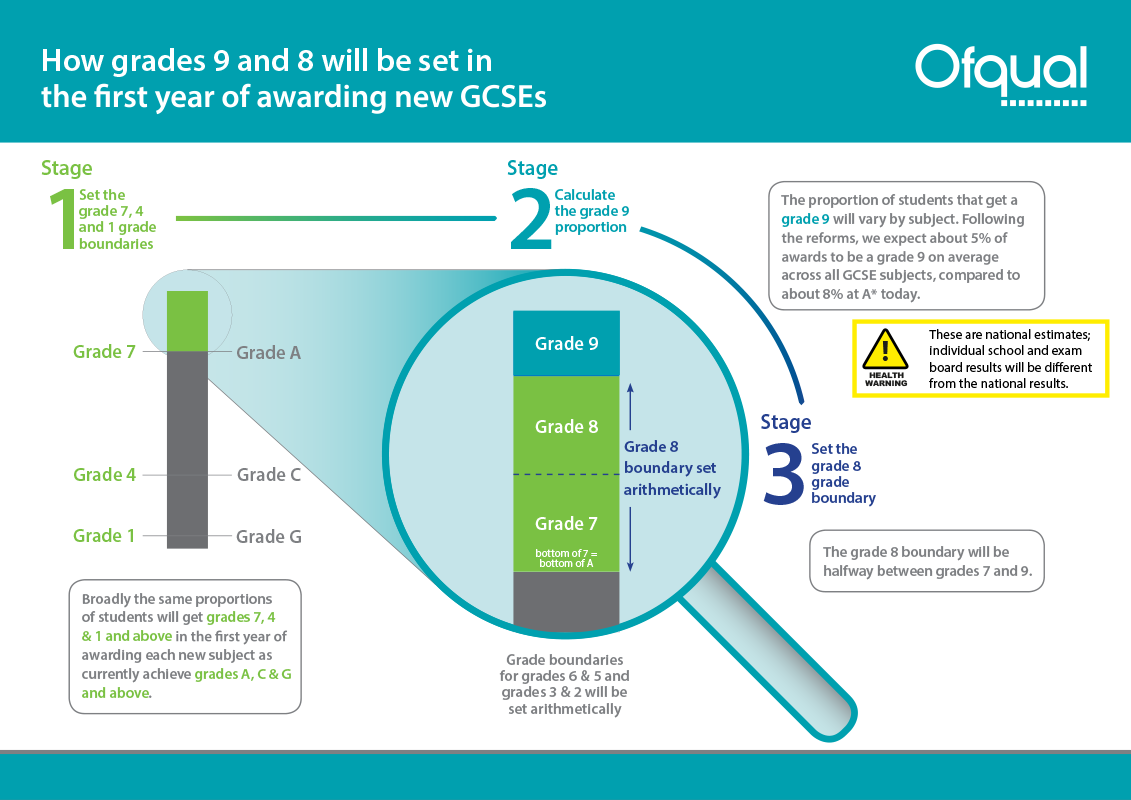
This summer sees the first awards of the new grade 9, in GCSE English language, English literature and maths. Grade 9 is not the same as A*; it’s a new grade, designed to recognise the very highest performing students. So there will be fewer grade 9s than there are currently A*s. And in the first year grade 9 will be calculated arithmetically.
Last year we announced the detail of how that will work, known as the ‘tailored approach’. This approach will mean that across all subjects (when all GCSEs are graded 9 to 1) about 20% of those students achieving grade 7 or above will achieve a grade 9. The formula is:
Percentage of those achieving at least a grade 7 who will be awarded a grade 9 = 7% + 0.5 × (percentage of students awarded grade 7 and above)
There is more detail on the rationale for the formula in the report 'Options for setting the grade 9 boundary in GCSEs' .
A worked example
Imagine that the proportion of students who have achieved at least the minimum number of marks required for a grade 7 in a particular subject is 19%. Take that 19% and divide it in half, which gives you 9.5%. Then add 7 to that figure, giving you 16.5%. Go back to the original percentage of students achieving grade 7 and above and work out 16.5% of that 19%, which is 3.135%. Identify the mark on the qualification level mark distribution that is closest to that figure, and that will be the grade 9 boundary. The grade 8 boundary will be set halfway between the grade boundary marks for 7 and 9. This process is summarised in figure 1.
There are two other questions we’ve been considering with exam boards:
- whether to use the performance of all students or a sub-set of students in each subject for the above calculations
- how to maintain the grade 9 standard in the second and subsequent years
Those questions are related, so I’ll start with the second one.
Which students to use
We have agreed with exam boards that, having set the standard in year 1 using the above formula, exam boards will use predictions in subsequent years to carry forward that standard. That’s why the question about which students to use for the calculation this year is important. In future years, the predictions will, as always, be based on matched students – for GCSE that means 16-year-old students who have been matched to their prior attainment at key stage 2.
If in subsequent years, we’re going to maintain standards using predictions for matched students, we should use the same population to set that standard this summer. We expect that the entry for the new GCSEs this summer will be mainly 16 year-olds but not exclusively. In order to be fair to all students, we will use the above formula to calculate the likely percentage of matched 16-year-old students that should achieve a grade 9, identify the mark closest to that percentage looking at the mark distribution for those matched students, and then apply the grade boundary to all students.
Modelling likely outcomes
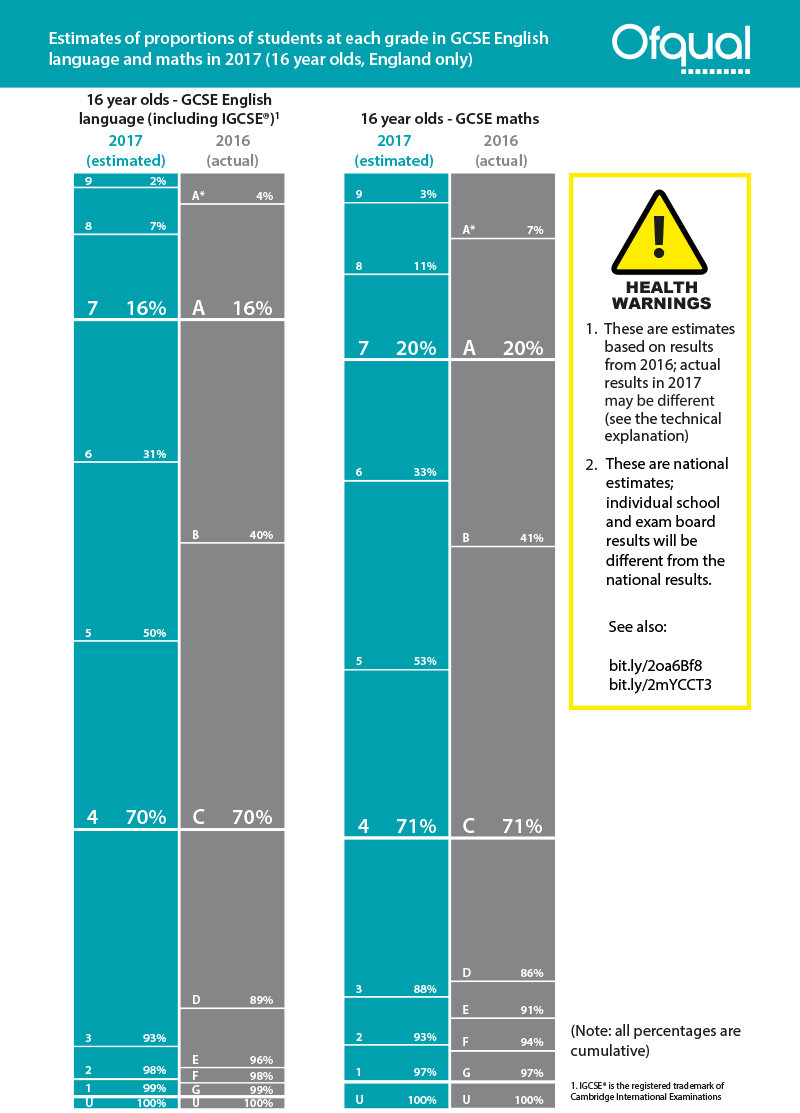
The numbers in the above example are hypothetical, but we have done some modelling of the likely proportions of students who will achieve each grade in GCSE English language and maths, including grade 9 this year. This is different from predicting grade boundaries, which I’ve previously discussed.
In 2016 we published some modelling by Education Datalab based on 2014 data. We’ve now done some more modelling, based on 2016 data and using the marks that students got in 2016.
The figures are show in figure 2. But before you look at the figures, please bear in mind these key points and note the health warnings we have included.
- These are our best estimates for England but individual exam boards’ results will be more varied (see the explanation in my previous blog), and individual schools could see very different proportions. We know that even when qualifications don’t change, results at school level do vary [see our previous reports].
- We can be more confident in our estimates at grades 7, 4 and 1 because the bottom of these grades will be set to align with the bottom of grades A, C and G in the previous A* to G grade structure (see figure 2 below). Other boundaries will be calculated arithmetically and so the proportions could vary a bit more from the figures here.
- As with any modelling, our figures are based on a number of assumptions. We had to use results from the previous versions of the specifications, and they are different, both in structure and in content.
- The figures are different to those in the Education Datalab modelling, because we used a different method. That’s why any figures should be seen as a guide and not a guarantee of what will happen.
- The modelling has been done at qualification level. We haven’t tried to estimate how many students might get a grade 9 in both English language and maths.
Cath Jadhav
Associate Director, Standards and Comparability
11 comments
Comment by Kerry posted on
How will this work for GCSEs with unusual grade distribution e.g. Triple award science where a much higher proportion of students currently get the higher grades because only the best students are entered? Will 7+ be capped at 20% and grade 9 at 7% of this 20% - therefore students be disadvantaged by taking this qualification and we will see entries dramatically decrease
Comment by Cath Jadhav posted on
The prediction aproach that the boards will use takes account of subjects where students might be higher (or lower) ability. Exam boards use predictions currently in the separate sciences: because the separate science cohort has a higher level of prior attainment than the cohort for science/additional science, the proportion of students achieving the higher grades is higher in the separate sciences. The same approach will be used in the new specifications. Grade 7 is not capped, but will be set so that broadly the same proportion of students will achieve a grade 7 as previously achieved a grade A. If the entry pattern remains similar in the new specifications and higher ability students (as measured by KS2 attainment) enter separate sciences than the Combined Science award, then the results for the separate sciences will be higher.
Comment by Peter posted on
A number of independent schools are doing IGCSE English which includes 40% coursework and open text exams. Will the grades their students receive still be factored in when it comes to comparable outcomes and allocating grades? If so, it seems incredibly unfair and it will potentially limit the number of 7+ grades that state school students can achieve despite sitting a much more rigorous GCSE.
Comment by Cath Jadhav posted on
The predictions that exam boards use to predict GCSE results at key grades will take account of the cohort's prior attainment at Key Stage 2. If this year's cohort has higher prior attainment, then results will be higher. Some independent schools may continue to enter for international GCSEs but these students will not affect (and will not limit) the grades awarded to students taking GCSEs.
Comment by Paul posted on
Can you please tell me if there is still a relationship between the 9-1 grades and the level of a GSE result as there was with A*-G where A*-C was considered a level 2 and therefore 20% of the level 1 and level 2 thresholds and a D-G grade was considered a level 1 result and therefore only counted for 20% at Level 1 and 0% at Level 2?
Comment by Mark Beckett posted on
In figure 2, should the grade 8 boundary for English Language be set at 9% not 7%?
Using the given methodology "The grade 8 boundary will be set halfway between the grade boundary marks for 7 and 9" where those figures are 16% and 2% would place grade 8 at 9%.
Comment by Cath Jadhav posted on
The grade 8 boundary is set at the mark that is halfway between 7 and 9, not at the cumulative percentage that is halfway between 7 and 9. In this modelling, the mark will have been calculated at halfway between the mark for 7 and the mark for 9, and there were 7% of students at that mark or higher.
Comment by Mick Blaylock posted on
Is there not a case for aligning the grade 3 with the current grade D given that GCSE resits are a condition of funding for those with grade 3? With GCSE mathematics grade 3 estimated at 17% of the entry compared with 15% in 2016 there could be an additional 23,150 candidates doing GCSE mathematics resits in 2017. Already the mathematics education community widely recognises that for many GCSE grade D students GCSE is not an appropriate progression route: even more so for the majority of these additional 23,150 students.
Comment by Mark Woodall posted on
Just so glad you've simplified the system so everyone knows the true value of the results...slightly tongue in cheek.
Comment by Louise posted on
I am concerned that the change to numbers at GCSE will demoralise our teenagers. An A grade was always seen as good. However a mark of 7/9 does not sound that good, so all over the country pupils, parents and teachers (and media) are saying - that's the equivalent of an A or B or A*.... because if a student gets for instance 10 GCSEs and some 7s, some 8s the top grade being 9 it sounds just OK - quite good whereas in reality this is amazing..... (I work in university and the students coming through have higher and higher levels of mental health concerns) please reconsider this grading system....
Comment by Louis Berk posted on
Seriously? Who writes this rubbish? And this is how our tax payers money is used?